
Nested Nutrition 2
Last time, I examined the relationship between macronutrients and total calories in the data obtained from menustat.org. If you’ll recall, there was something curious about a model I fit. While my coefficients were close to what would be expected, they were not perfect, and the way in which they weren’t perfect was intriguing. Here is the model:
m.1 <- lmer(Calories ~ Proteing + Carbohydratesg + TotalFatg +
       (1+Proteing+Carbohydratesg+TotalFatg|Restaurant), data=df)
summary(m.1)
## Linear mixed model fit by REML ['lmerMod']
## Formula:
## Calories ~ Proteing + Carbohydratesg + TotalFatg + (1 + Proteing +
## Carbohydratesg + TotalFatg | Restaurant)
## Data: df
##
## REML criterion at convergence: 885871
##
## Scaled residuals:
## Min 1Q Median 3Q Max
## -40.34 -0.21 0.00 0.21 24.99
##
## Random effects:
## Groups Name Variance Std.Dev. Corr
## Restaurant (Intercept) 167.3548 12.937
## Proteing 0.7062 0.840 -0.01
## Carbohydratesg 0.0882 0.297 -0.51 -0.12
## TotalFatg 1.0242 1.012 -0.16 -0.81 -0.16
## Residual 806.2774 28.395
## Number of obs: 92732, groups: Restaurant, 145
##
## Fixed effects:
## Estimate Std. Error t value
## (Intercept) 4.8252 1.1064 4.4
## Proteing 4.2157 0.0720 58.5
## Carbohydratesg 3.8228 0.0255 149.7
## TotalFatg 8.8371 0.0858 103.0
##
## Correlation of Fixed Effects:
## (Intr) Protng Crbhyd
## Proteing -0.014
## Carbhydrtsg -0.503 -0.131
## TotalFatg -0.163 -0.800 -0.161Note that the estimates in the model are very close to what we would expect, based on the lawful relationship between each macronutrient and calories:
- Fats: 9 kcal/gram
- Protiens: 4 kcal/gram
- Carbohydrates: 4 kcal/gram
However, it isn’t perfect. Indeed, the estimates all move in the same direction one would expect if there was some kind of social desireability bias at play (i.e. higher than expected protein, lower than expected carbs & fats). To investigate this more closely, I created an index of the random effects which is a measure of how much each restaurant’s nutrition information is biased in socially desireable ways. I refer to the index as ‘reporting tendency’. Negative numbers represent nutrition information which is more socially desireable
rf <- ranef(m.1)
df.rf <- rf$Restaurant
head(df.rf)
## (Intercept) Proteing Carbohydratesg TotalFatg
## 7 Eleven -1.214 -0.05989 0.136732 -0.003768
## A&W -1.068 1.33639 -0.008236 -1.183272
## Applebee's -6.364 -0.35479 0.078160 0.278029
## Arby's -3.524 -0.29456 -0.041749 0.476778
## Au Bon Pain -2.783 0.20673 -0.088042 0.045590
## Auntie Anne's -4.393 0.39019 0.129079 0.095354df.rf$Proteing <- scale(df.rf$Proteing)
df.rf$Proteing <- df.rf$Proteing*-1
df.rf$Carbohydratesg <- scale(df.rf$Carbohydratesg)
df.rf$TotalFatg <- scale(df.rf$TotalFatg)
library(ggplot2)
df.rf$reporting.tendency <- df.rf$Proteing + df.rf$Carbohydratesg +
df.rf$TotalFatg
ggplot(df.rf, aes(x=reporting.tendency)) +
geom_histogram(binwidth=.2, fill='#144256') +
theme_bw() + ylab('Count') + xlab('Reporting Tendency')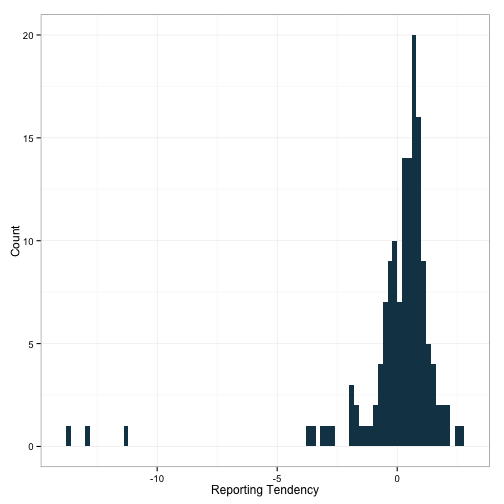
Note that we’ve got a couple of clear outliers. It could be these restaurants which are driving this pattern. Perhaps this is another instance of the data being mis-entered. Let’s dive in and see who these two are.
df.rf[which(df.rf$reporting.tendency < -10), ]## (Intercept) Proteing Carbohydratesg TotalFatg
## Godfather's Pizza 19.16 -4.521 -5.4093 -1.449
## Pollo Tropical 25.05 -5.326 0.9409 -8.517
## Round Table Pizza 8.69 -6.971 -0.9307 -5.879
## reporting.tendency
## Godfather's Pizza -11.38
## Pollo Tropical -12.90
## Round Table Pizza -13.78Remember that these random effects estimates have all been standardized, so when you see that the estimate for fat is -8.6 as it is for Round Table Pizza, that means that the random effect of total fat for Round Table is 8.6 standard deviations below the mean! Clearly, we should examine the raw data for these two companies. Since they both have quite a large number of items (789 for Godfather, 1266 for Round Table), I’m going to place them into their own dataframe and then look at a scatter of each macronutrient against total calories.
df.pizza <- rbind(df[which(df$Restaurant == "Godfather's Pizza"),],
                      df[which(df$Restaurant == "Round Table Pizza"),])
ggplot(df.pizza, aes(x=Carbohydratesg, y=Calories)) +
  geom_point(color='#88301B') + facet_wrap(~Restaurant) +
  theme_bw()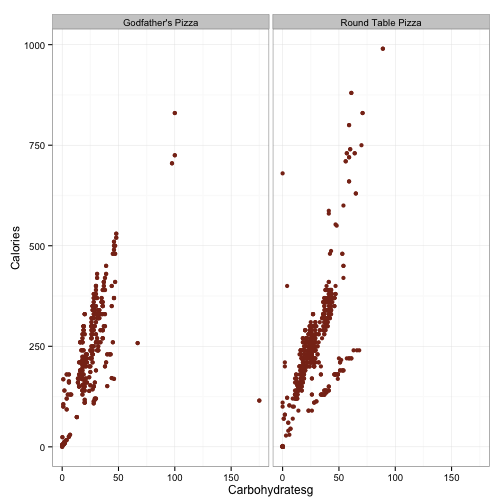
ggplot(df.pizza, aes(x=TotalFatg, y=Calories)) +
  geom_point(color='#88301B') + facet_wrap(~Restaurant) +
  theme_bw()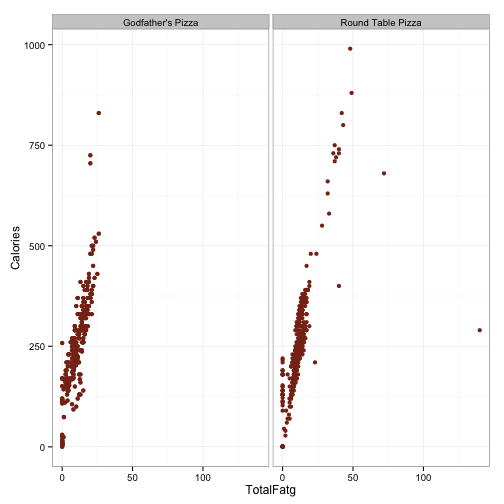
ggplot(df.pizza, aes(x=Proteing, y=Calories)) +
  geom_point(color='#88301B') + facet_wrap(~Restaurant) +
  theme_bw()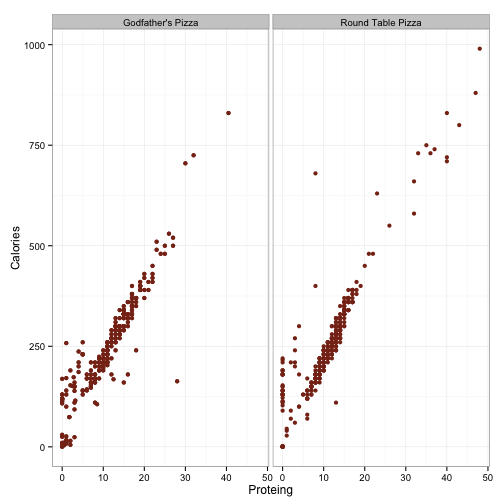
This doesn’t look like anything too fishy. I’m guessing that the huge effect of carbs in Godfather’s is being driven by the outlier way out ~175 carbs and 125 calories. Ditto for Round Table being driven by the outlier out near 150 grams of fat. Interestingly, the plot for carbohydrates seems to have two distinct groups in both chains, but it is esspecially pronounced for Round Table. Note all the data points clustered together in a line that is below the larger cluster. It looks like if we define a line that runs through the origin and the point (x=50, y=250), we can just grab the values which are below that for a sense of what these items are. Let’s give that a shot.
df.pizza$line <- 5*df.pizza$Carbohydratesg
ggplot(df.pizza, aes(x=Carbohydratesg, y=Calories)) +
  geom_point(color='#88301B') + facet_wrap(~Restaurant) +
  geom_line(aes(x=Carbohydratesg, y=line), color='#144256')+
  theme_bw()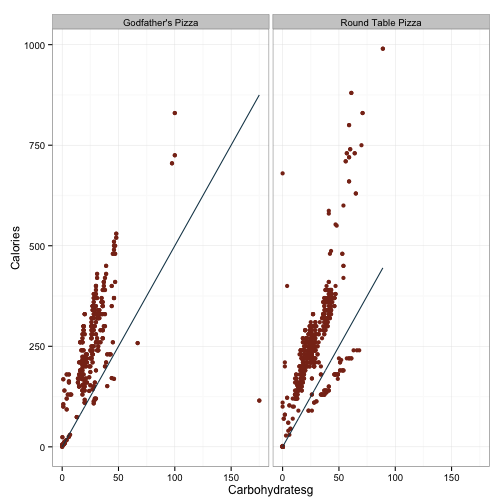
That looks okay. Let’s get everything smaller than the values in that line.
df.pizza[sample(which(df.pizza$Calories < df.pizza$line), 20),c(1, 3, 11, 12, 18, 21)]## Restaurant Item_Name. Calories TotalFatg
## 133232 Round Table Pizza Mug Root Beer, Large 220 NA
## 69334 Godfather's Pizza Classic Coke 117 0.0
## 133303 Round Table Pizza Pepsi, Medium 180 0.0
## 69223 Godfather's Pizza Beet Slices 26 0.0
## 132481 Round Table Pizza BBQ Sauce 216 0.0
## 133304 Round Table Pizza Pepsi, Medium 180 NA
## 69659 Godfather's Pizza Pink Lemonade 113 0.0
## 133511 Round Table Pizza Tropicana Apple Juice 90 NA
## 133523 Round Table Pizza Tropicana Lemonade, Large 220 NA
## 133514 Round Table Pizza Tropicana Fruit Punch, Large 240 NA
## 69655 Godfather's Pizza Pineapple Tidbits 108 0.0
## 133360 Round Table Pizza Sierra Mist, Small 130 0.0
## 69301 Godfather's Pizza Cherry Coke 120 0.0
## 69170 Godfather's Pizza Baby Carrots 8 0.0
## 133234 Round Table Pizza Mug Root Beer, Medium 180 0.0
## 69679 Godfather's Pizza Raisins 151 0.0
## 69416 Godfather's Pizza Fat Free Italian 30 0.0
## 133510 Round Table Pizza Tropicana Apple Juice 90 0.0
## 133520 Round Table Pizza Tropicana Fruit Punch, Small 140 NA
## 69574 Godfather's Pizza Monkey Bread, Italian 115 3.8
## Carbohydratesg Proteing
## 133232 57 NA
## 69334 29 0.0
## 133303 49 0.0
## 69223 6 1.0
## 132481 52 0.0
## 133304 49 NA
## 69659 28 0.0
## 133511 23 NA
## 133523 59 NA
## 133514 66 NA
## 69655 28 0.0
## 133360 35 0.0
## 69301 29 0.0
## 69170 2 0.0
## 133234 46 0.0
## 69679 40 2.5
## 69416 7 0.0
## 133510 23 0.0
## 133520 39 NA
## 69574 175 3.2Ah. Basically, this is soda, which is typically made up of nothing but carbohydrates.
Okay, let’s remove the two crazy outliers and see about refitting the model.
library(dplyr)
df %>%
  filter(TotalFatg>125) %>%
  filter(Restaurant == "Round Table Pizza")
## Restaurant Food.Category.
## 1 Round Table Pizza Pizza
## Item_Name. Menu_Item_ID year
## 1 Smokehouse Combo on Original Crust, Large 72354 2014
## ItemDescription ServingsPerItem ServingSize
## 1 Smokehouse Combo on Original Crust, Large 12 117
## ServingSizeUnit ServingsSizeText Calories TotalFatg SaturatedFatg
## 1 <NA> 1 Slice 290 140 6
## TransFatg Cholesterolmg Sodiummg Potassiummg Carbohydratesg Fiberg
## 1 0 40 720 <NA> 26 2
## Sugarg Proteing
## 1 3 13df %>%
filter(Carbohydratesg>150) %>%
filter(Restaurant == "Godfather's Pizza")## Restaurant Food.Category. Item_Name. Menu_Item_ID year
## 1 Godfather's Pizza Baked Goods Monkey Bread, Italian 43760 2014
## 2 Godfather's Pizza Baked Goods Monkey Bread, Italian 43760 2013
## ItemDescription ServingsPerItem ServingSize
## 1 Monkey Bread, Italian, 9 in Foil Pan 6 42
## 2 Monkey Bread, Italian, 9 in Foil Pan 6 42
## ServingSizeUnit ServingsSizeText Calories TotalFatg SaturatedFatg
## 1 <NA> 1/6 Dish 115 3.8 0.75
## 2 <NA> 1 Slice 115 3.8 0.75
## TransFatg Cholesterolmg Sodiummg Potassiummg Carbohydratesg Fiberg
## 1 0 0 162 <NA> 175 0.8
## 2 0 0 162 <NA> 175 0.8
## Sugarg Proteing
## 1 0.83 3.2
## 2 0.83 3.2Okay, items 72354 and 43760. We can remove those without too much difficulty. Let’s just double check that we wont do too much damage by removing all carb and fat entires with those values.
df[which(df$Menu_Item_ID == 43760),]## Restaurant Food.Category. Item_Name. Menu_Item_ID
## 69574 Godfather's Pizza Baked Goods Monkey Bread, Italian 43760
## 69575 Godfather's Pizza Baked Goods Monkey Bread, Italian 43760
## 69576 Godfather's Pizza Baked Goods Monkey Bread, Italian 43760
## year ItemDescription ServingsPerItem
## 69574 2014 Monkey Bread, Italian, 9 in Foil Pan 6
## 69575 2013 Monkey Bread, Italian, 9 in Foil Pan 6
## 69576 2012 <NA>
## ServingSize ServingSizeUnit ServingsSizeText Calories TotalFatg
## 69574 42 <NA> 1/6 Dish 115 3.8
## 69575 42 <NA> 1 Slice 115 3.8
## 69576 <NA> <NA> NA NA
## SaturatedFatg TransFatg Cholesterolmg Sodiummg Potassiummg
## 69574 0.75 0 0 162 <NA>
## 69575 0.75 0 0 162 <NA>
## 69576 <NA> <NA> <NA> <NA> <NA>
## Carbohydratesg Fiberg Sugarg Proteing
## 69574 175 0.8 0.83 3.2
## 69575 175 0.8 0.83 3.2
## 69576 NA <NA> <NA> NAdf[which(df$Menu_Item_ID == 72354),]## Restaurant Food.Category.
## 133381 Round Table Pizza Pizza
## 133382 Round Table Pizza Pizza
## 133383 Round Table Pizza Pizza
## Item_Name. Menu_Item_ID year
## 133381 Smokehouse Combo on Original Crust, Large 72354 2014
## 133382 Smokehouse Combo on Original Crust, Large 72354 2013
## 133383 Smokehouse Combo on Original Crust, Large 72354 2012
## ItemDescription ServingsPerItem
## 133381 Smokehouse Combo on Original Crust, Large 12
## 133382 <NA>
## 133383 <NA>
## ServingSize ServingSizeUnit ServingsSizeText Calories TotalFatg
## 133381 117 <NA> 1 Slice 290 140
## 133382 <NA> <NA> NA NA
## 133383 <NA> <NA> NA NA
## SaturatedFatg TransFatg Cholesterolmg Sodiummg Potassiummg
## 133381 6 0 40 720 <NA>
## 133382 <NA> <NA> <NA> <NA> <NA>
## 133383 <NA> <NA> <NA> <NA> <NA>
## Carbohydratesg Fiberg Sugarg Proteing
## 133381 26 2 3 13
## 133382 NA <NA> <NA> NA
## 133383 NA <NA> <NA> NAChecks out okay - the other years are all NA anyway. Let’s remove and refit the model
df$Carbohydratesg[which(df$Menu_Item_ID == 43760)] <- NA
df$TotalFatg[which(df$Menu_Item_ID == 72354)] <- NA
m.2 <- lmer(Calories ~ Proteing + Carbohydratesg + TotalFatg +
       (1+Proteing+Carbohydratesg+TotalFatg|Restaurant), data=df)
summary(m.2)
## Linear mixed model fit by REML ['lmerMod']
## Formula:
## Calories ~ Proteing + Carbohydratesg + TotalFatg + (1 + Proteing +
## Carbohydratesg + TotalFatg | Restaurant)
## Data: df
##
## REML criterion at convergence: 884749
##
## Scaled residuals:
## Min 1Q Median 3Q Max
## -40.58 -0.21 0.00 0.21 25.13
##
## Random effects:
## Groups Name Variance Std.Dev. Corr
## Restaurant (Intercept) 164.2901 12.818
## Proteing 0.3646 0.604 -0.12
## Carbohydratesg 0.0694 0.263 -0.51 0.16
## TotalFatg 0.7674 0.876 -0.14 -0.78 -0.33
## Residual 797.8727 28.247
## Number of obs: 92729, groups: Restaurant, 145
##
## Fixed effects:
## Estimate Std. Error t value
## (Intercept) 4.6367 1.0963 4.2
## Proteing 4.1541 0.0528 78.7
## Carbohydratesg 3.8362 0.0228 168.6
## TotalFatg 8.8854 0.0747 119.0
##
## Correlation of Fixed Effects:
## (Intr) Protng Crbhyd
## Proteing -0.123
## Carbhydrtsg -0.503 0.132
## TotalFatg -0.142 -0.764 -0.325Looks a bit better. I guess I was making a mountain out of a mole hill. We could continue to play the remove-the-outlier game all day, I’m sure, but I’m not really interested in doing it.